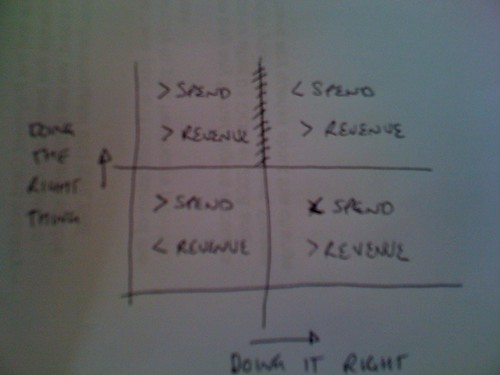
If you look at the image below, you'll see an XY graph, along the Y axis is doing the right thing, i.e. building the right solution. Along the X axis is doing it right, i.e. building the solution well. There was some studies into these metrics, but I don't know what it is, so I'm just going to use pseudo numbers.
In the lower left quadrant, you'll see doing the wrong thing, and doing it badly. The cost of the project is greater than the average IT project, and the revenue is lower than expected. In the upper left quadrant your doing the right thing, but you're doing it wrong. Your costs are still larger than average but you are making more revenue as you're building the required product. In the bottom right you're doing the wrong thing, but you're doing it well so your costs are lower than average, but your revenue isn't as good as expected. In the top right, you're doing the right thing and you're doing it well. Your costs are lower than average, and your revenue is higher than expected.
Now, of course, this is abstract and to be taken with a large pinch of salt, but there are some interesting deductions to be made. Firstly, we were told that according to the study, it's near impossible to go from building the right thing badly to building the right thing well. Looking at the rest, it seems intuitive that if you were doing the wrong thing badly, you'd want to do the right thing badly before doing the right thing well, but in actual fact, it's less costly and more efficient to do the wrong thing well and progress to building the right thing well.
So, where's your project on the quadrant, where do you want to be and how to you want to get there?